
 Facebook
 X
X
 Pinterest
 Copy Link
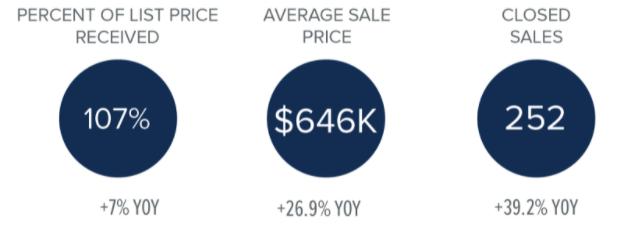
Data for the second quarter is out, and North Kitsap’s real estate market exceeded our expectations. Below you’ll find a list of key highlights with helpful insights to keep you informed about our local market.
Our Strong Seller’s Market
Our inventory remains low and demand remains high. Remote work is now a prevalent part of our new working culture, and this enables many buyers to consider areas outside major cities. Eager buyers are outnumbering sellers in more rural markets. Our Brokers continue to experience situations where some buyers are outbid either by price or by an all-cash offer in this competitive market.
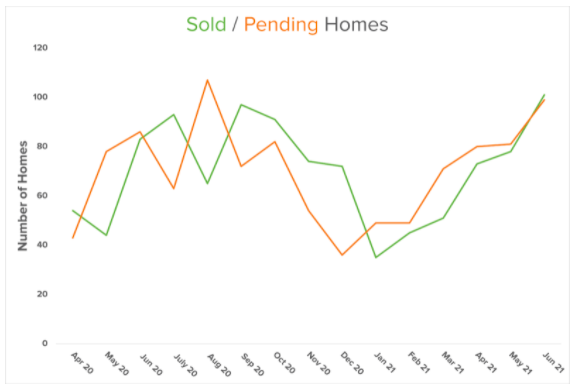
If you look at the last five quarters detailed in the graph below, there is a clear growth trend. This includes when you’re comparing 2020’s second quarter to 2021’s second quarter. This data indicates the market will continue to heat up this summer, which we’re already seeing.
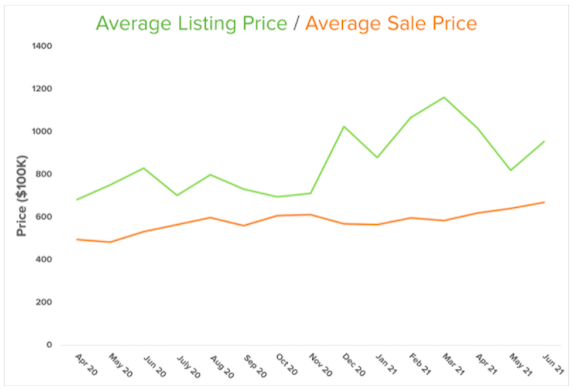
Due to the low supply, prices are still on the rise. And, as you can see below, the listing and sale price divergence is shrinking now. Sellers can continue to ask for higher prices as a benefit of our inventory shortage. Also, historically low mortgage rates enable buyers to meet the home price increase.
Market Insights From Our Chief Economist
In his most recent Monday with Matthew, our Chief Economist, Matthew Gardner, begins with the staggering fact that “prices have risen almost three-fold, as the cost to finance has dropped by 72%.” If the number sounds too good (or bad) to be true, that’s because it is. To get an accurate picture, you also have to factor in inflation. Gardner explains that “just like other goods and services, the price of a house today is not directly comparable to the price of that same house 30 years ago because of the long run influence of inflation.” When you adjust for inflation, the rise in housing prices becomes less drastic. Without adjusting for inflation, “prices have risen by 268%”. But when you adjust for inflation, the “real prices have increased by 83.6%”. Therefore, the increase is much lower than what most people are discussing today.
Matthew also compares mortgage payments, another important piece of the puzzle. Although, without adjusting for inflation, “mortgage payments have increased by 74.3%,” the inflation-adjusted “real payments are 10.7% lower!” Of course, there are other monthly payments associated with home ownership. This includes property taxes, which do not change with market fluctuations. But this still indicates “that prices have been able to rise so significantly because mortgage rates have dropped”. It’s also because “inflation-adjusted home prices really haven’t skyrocketed – contrary to popular opinion.”
However, Matthew clarifies saying, “there are some markets across the country where the picture isn’t quite as rosy. In these places, prices have risen significantly more than the national average.” The Seattle metropolitan subunit (which extends around our local area) is one of these places. This is largely due to the increasing affluence as a result of the tech boom.
Not a Housing Bubble
Gardner’s bottom line is this: “there are quantifiable reasons to believe that we are not in a national housing bubble today.” However, he does point out that some markets will see a slowdown in price growth given “where prices are today in concert with the spectre of rising mortgage rates.” Ultimately, it’s still a strong seller’s market with an overall low supply and high demand. We expect to continue to see issues with affordability as prices and mortgage rates continue to climb.
