
 Facebook
 Twitter
 Pinterest
 Copy Link
Kitsap Market News & Insights

While Kitsap County’s housing market isn’t seeing the intense engagement it saw at the height of the pandemic, it has been heating up this summer. We are seeing a shift toward a more balanced market, but the average home sale price still remains high at $694K, just a 1.6% drop from this same time last year. Our Brokers are still working with eager buyers and satisfied sellers, but there aren’t as many multiple-offer situations.
Matthew Gardner, Windermere’s Chief Economist, recently released his latest “Monday with Matthew” video. In it, he evaluates his 2023 real estate predictions. Have they come to fruition? Will these predictions come true in the second half of the year? Watch his video and keep reading for key takeaways.
Key Takeaways from Gardner’s Mid-Year Update
Gardner believes that interest rates will be less frantic in the second part of the year, but will likely still not drop below 6%. Also, he points out that according to his calculation, 20 million homeowners have mortgage rates around 3%, making it unlikely they will move. Known as the lock-in effect, the higher interest rates are disincentivizing some sellers from listing their homes.
Gardner states that “affordability has not improved,” since financing and home costs are not aligning with incomes. Noting that each market varies across the country, he predicted that it will generally stay a seller’s market through the rest of 2023.
Advice for Homebuyers in Kitsap County
What does this mean for buyers looking at homes for sale in Kitsap County? As always, it’s important to connect with a knowledgeable, local Realtor so that you can make data-informed decisions with an expert negotiator and guide. Also, it’s important to analyze the market and your current situation. So, consider these factors when deciding whether to buy a house now or wait. Each person’s financial picture and goals for owning a home are unique.
Advice for Sellers in Kitsap County
If you are thinking of selling your home here in Kitsap County, a local real estate expert will ensure that your home is thoughtfully and strategically prepared for the market. Also, they can conduct a Comparative Market Analysis (CMA). This report compares your home to other homes in the area that have recently sold and are similar in terms of size, property, and condition. A CMA will help you better understand your local market, the demand for homes like yours, and how to properly price your home. It’s also important to discuss repairs or potential home upgrades so you can sell your home for the highest price point possible in the ideal timeframe. If you’re concerned about the cost of home repairs and getting your home ready to sell, consider the Windermere Ready Program. This program allows you to access the equity in your home to cover improvement costs, and we’ve seen many sellers achieve success through this program.
Kitsap’s Market: First Quarter, 2022
Kitsap County’s real estate market had a solid first quarter. In 2021, we saw strong buyer demand and low inventory, and that continues to be the case. It’s still a seller’s market, with many homes continuing to sell above the asking price. We’ve compiled key highlights and market trends below. And, if you have any questions our local experts are here to help.
News on Sold and Pending Homes
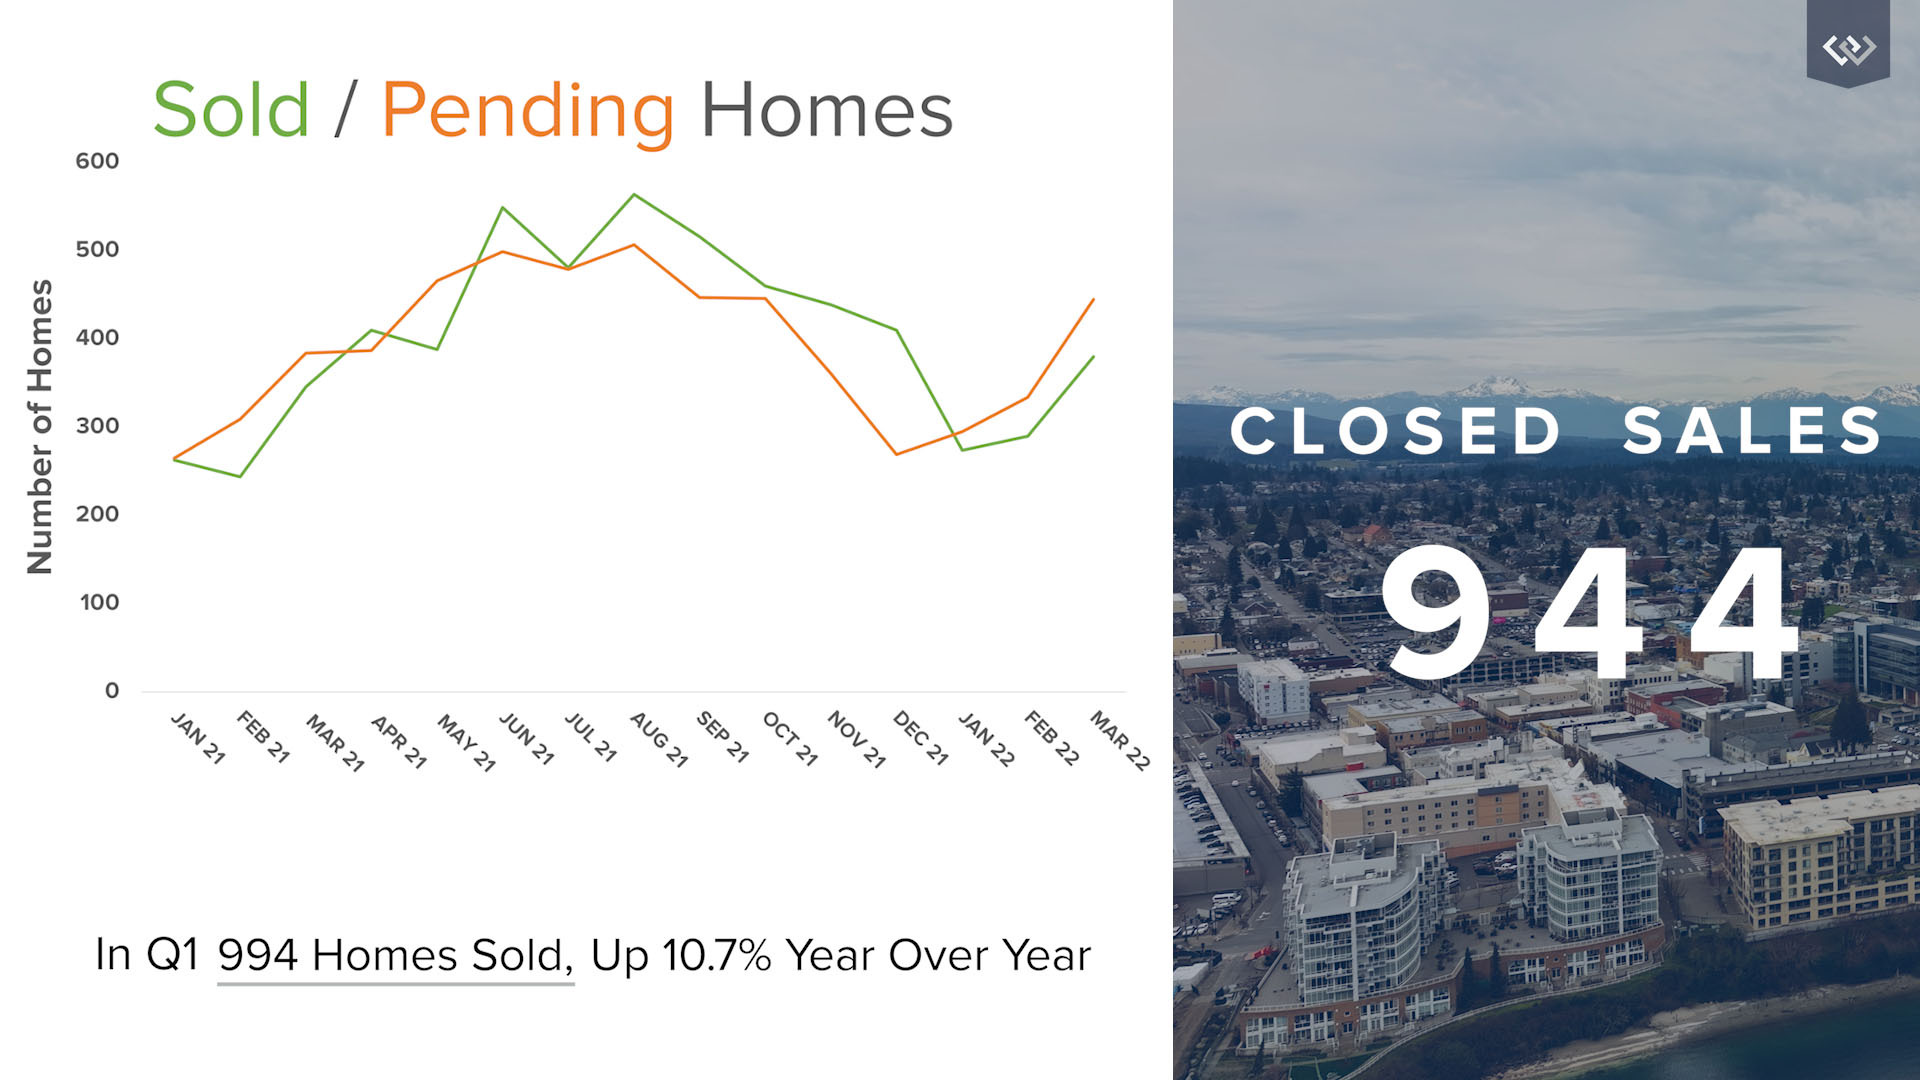
In the graph above, you can see a similar rise reflected in market volume that we saw this time last year. This follows the typical real estate market trend of a cooler first quarter before the market heats up in the summer. Sold homes still outpace pending listings and home prices are still increasing as a result of high demand. During 2022’s first quarter, 994 homes were sold. That’s up 10.7% year-over-year, showing more market activity.
Kitsap’s Market Still Favors Sellers
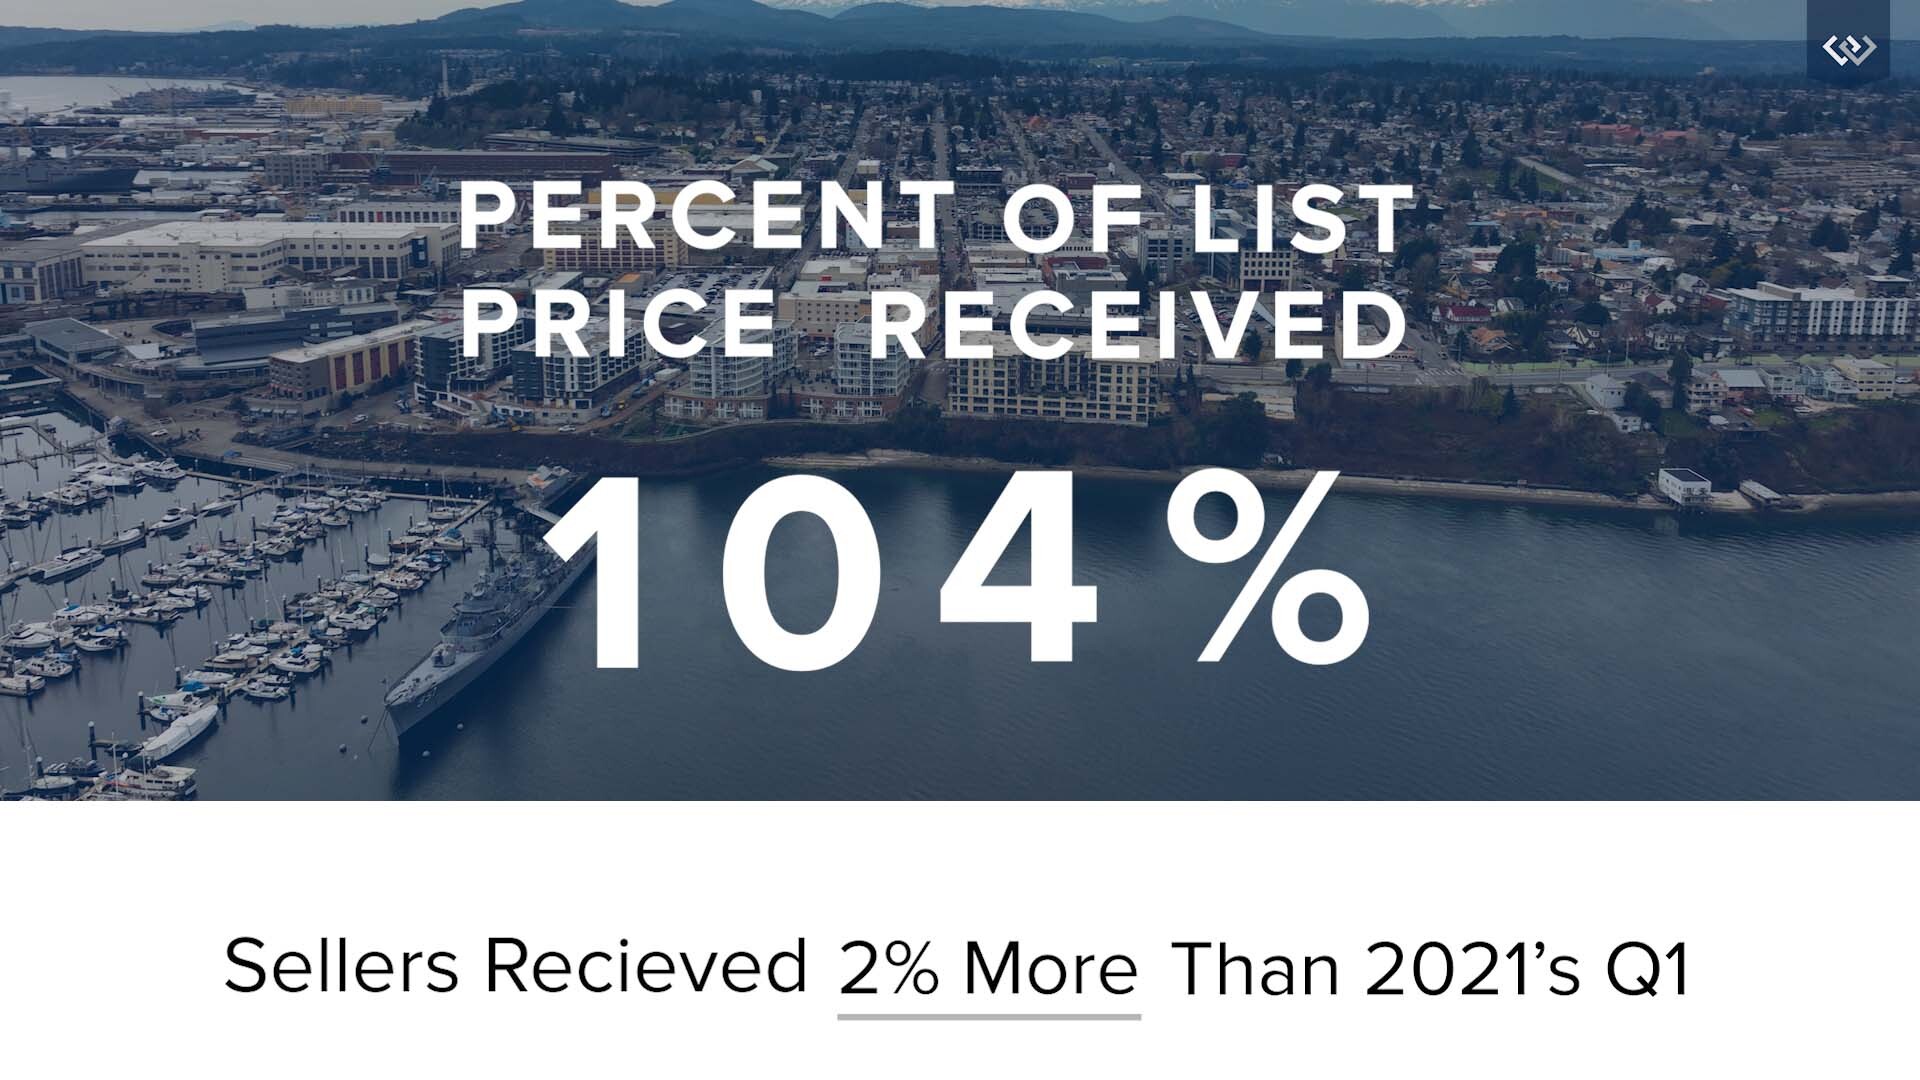
As supply remains low, sellers can list with confidence. Buyers will need to be prepared for competition. We do expect to see more homes come on the market as construction ramps back up, supply chain issues decrease, and the pandemic wanes.
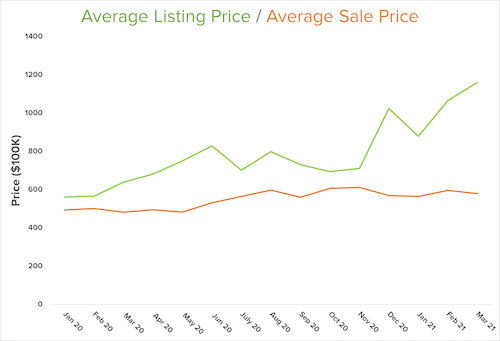
Listing Price vs. Sale Price
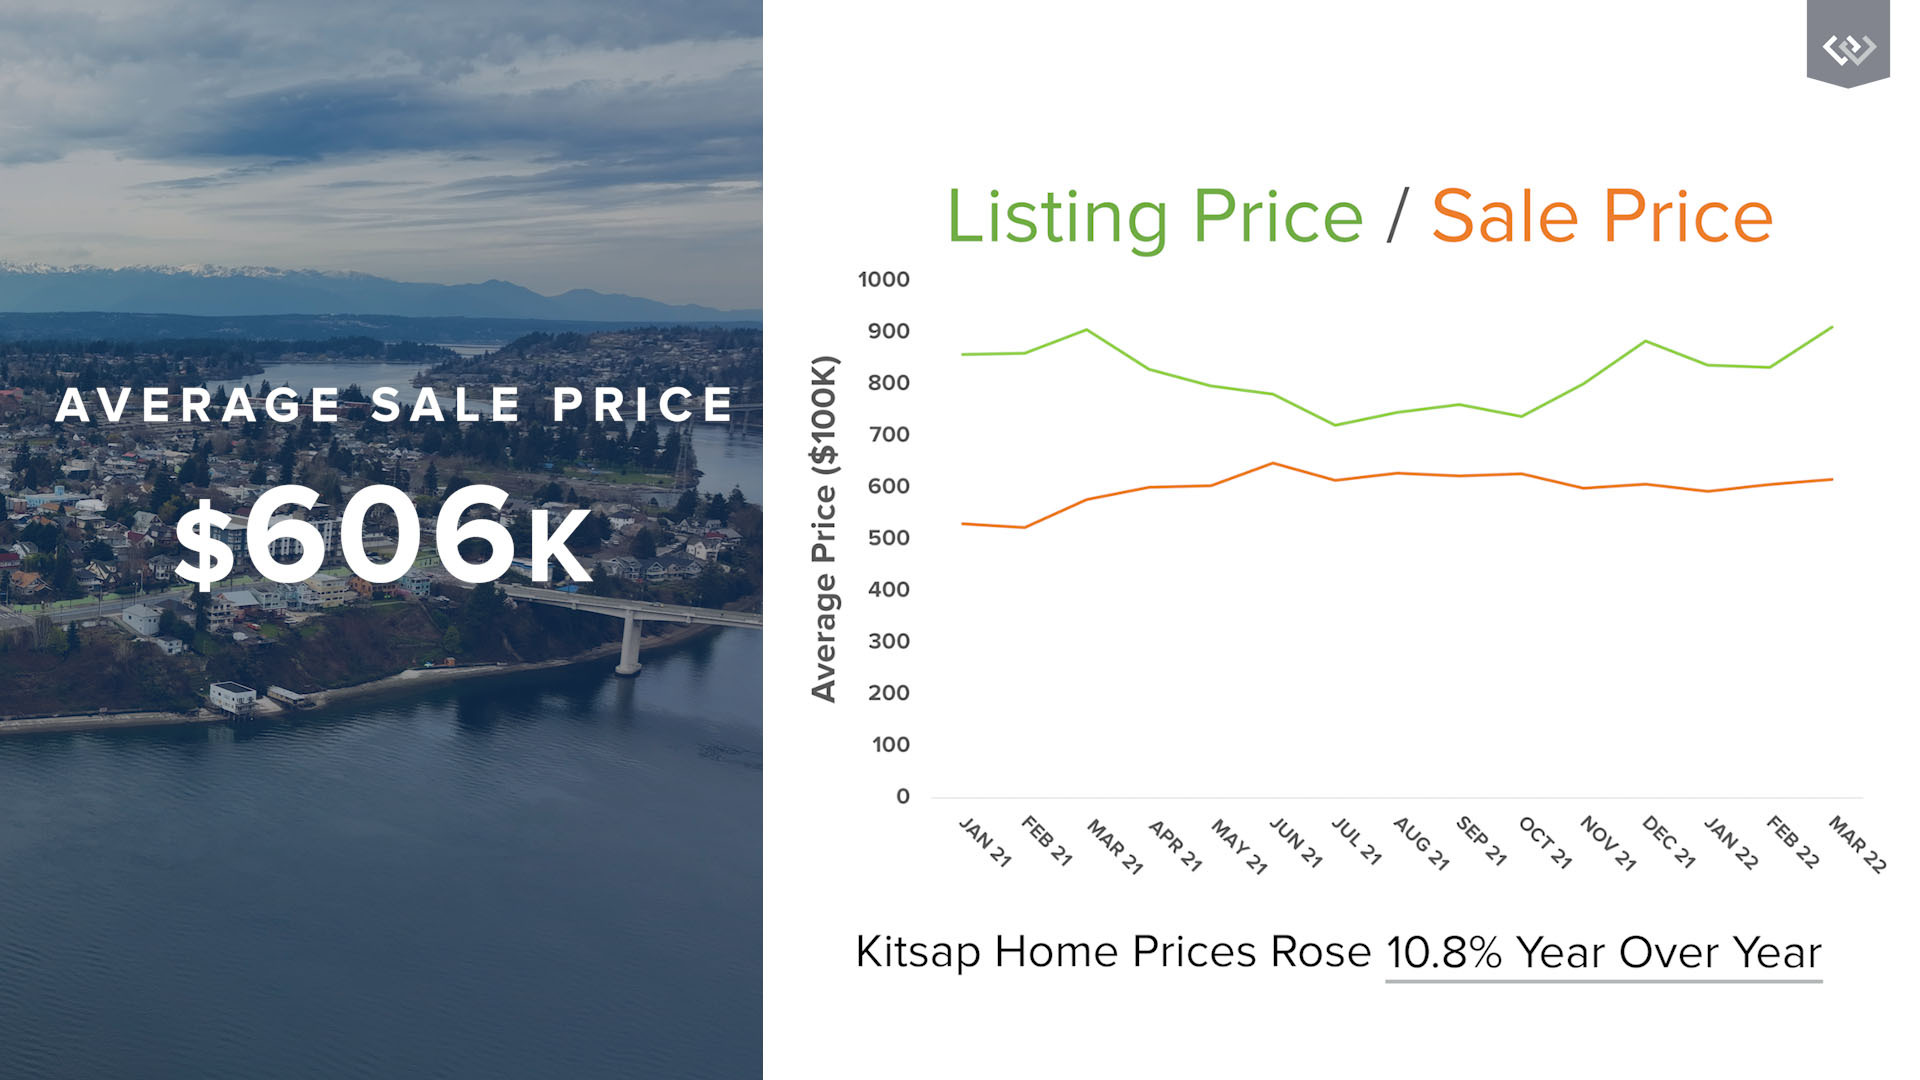
Kitsap’s market still has many eager buyers and during Q1, we saw a 10.8% increase in home prices year-over-year. We expect prices to continue to rise since many buyers will continue to meet sellers’ pricing demands. We are also seeing more affordability issues for others who want to buy in our area. Currently, the average sale price in Kitsap County is $606,000.
Insights from Our Chief Economist
Matthew Gardner, Windermere’s Chief Economist, shared his Top 10 Predictions for 2022 in one of his recent Monday with Matthew videos. Here’s what Gardner predicts for 2022:
- Prices will continue to rise, though the pace of appreciation will slow. Gardner thinks it will be about 6% in 2022 versus the massive 16% rise of 2021.
- Spring will be busier than expected. This will increase buyer demand, as buyers get more clarity in their new hybrid model combining remote and office work.
- The rise of the suburbs will also result from this work hybrid model. Many buyers are moving within the same area they already lived in.
- New construction jumps since the cost to build has come down.
- Zoning issues will be addressed.
- Climate change will impact where buyers live. People will focus more on how safe a location is in relation to natural disasters.
- Urban markets will bounce back after the demand drop from Covid.
- A resurgence in foreign investors will return since the travel bans were lifted last November. The demand will rise as long as our borders remain open.
- First-time buyers will be an even bigger factor in 2022. This year, 4.8 million millennials will turn 30, the median age of first-time buyers in the U.S. First-time buyers will be looking for cheaper markets.
- Forbearance will come to an end and that will be okay. It was well thought out, and as Gardner says, “as of recording this video, there are now fewer than 900,000 owners still in the program.” Hopefully, this continues to drop.
Additional Information
You can learn more from Matthew Gardner by reading his Market Update by region or watching his Monday with Matthew video series.
If you’re new to our area, check out our free Guide to Kitsap. If you’re interested in buying or selling, our local experts are here to help.
Third Quarter Review for North Kitsap’s Market

Our North Kitsap real estate market continues to grow more competitive for buyers. Read on for key highlights about our strong seller’s market.
Our Competitive Seller’s Market
North Kitsap’s inventory is now lower than this time last year and demand is consistently high. With the new remote working norm, the greener pastures of Kitsap living are more possible for many. And, these eager buyers outnumber sellers – reflected in the lower volume of closed sales when compared to the same time last year. Our Brokers continue to experience competitive buyer battles. Looking to buy? Don’t let that discourage you. Our local experts will help you every step of the way.
Market Data
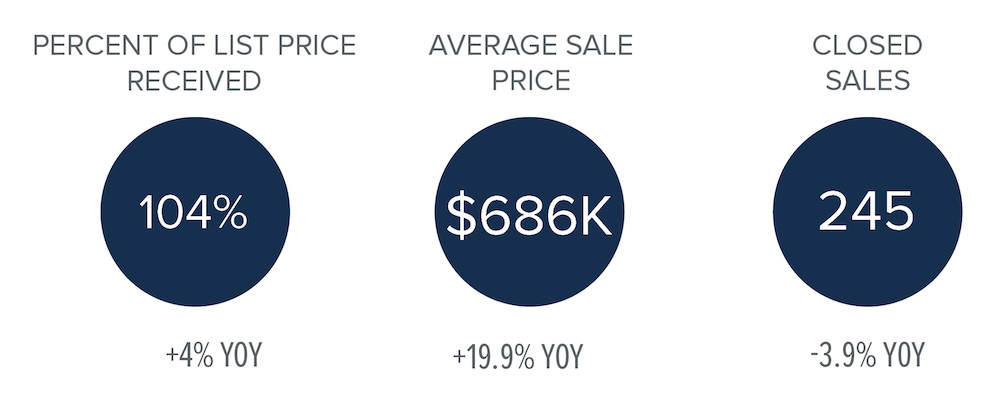
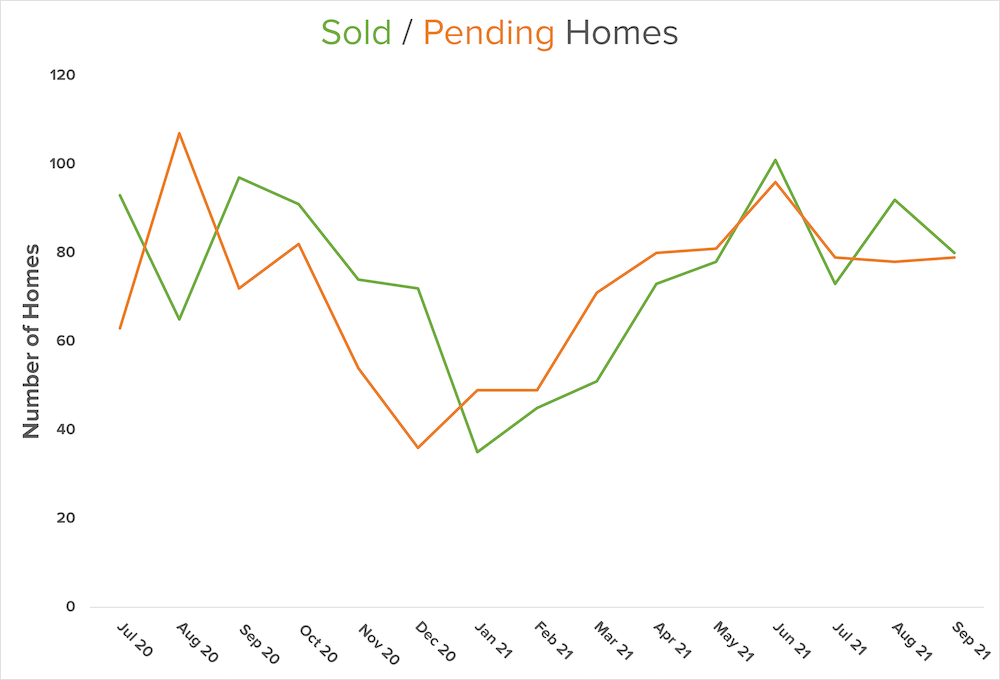
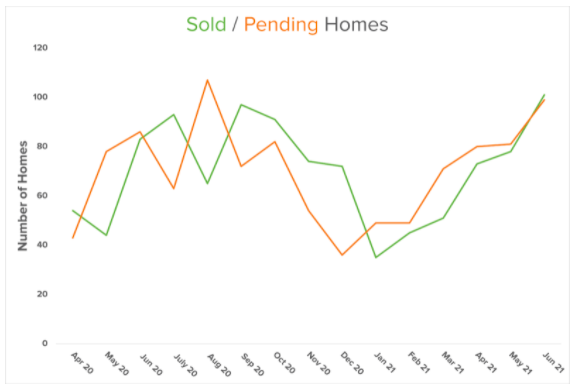
There is a noticeable sales volume plateau in our third quarter of 2021 when compared to the rising volume of last quarter. However, home prices are still increasing at a consistent rate. This price growth may decrease as we enter the slower season and inventory declines. If price growth does slow, we will see a shift toward a more balanced market.

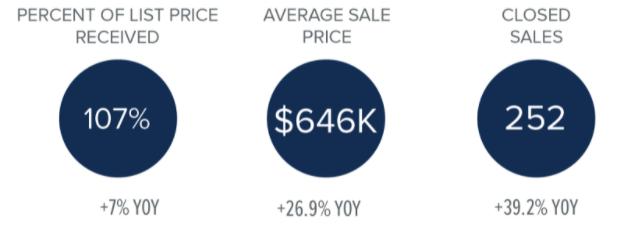
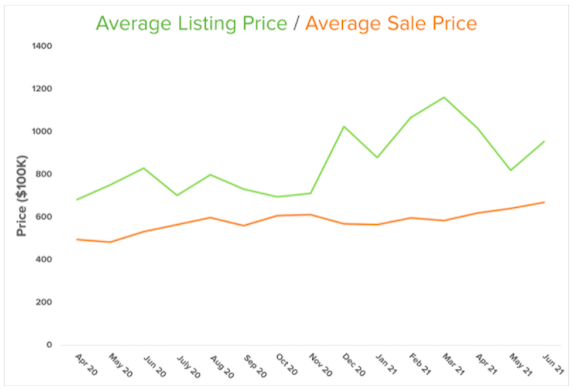
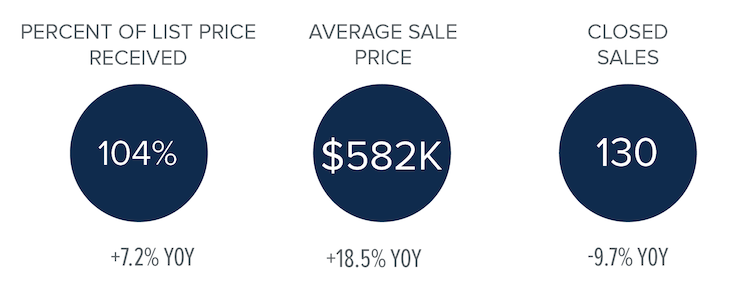
North Kitsap sale prices are strong, and the percent of list price received has increased 4% year-over-year. As you can see in our graph, the listing and sale price divergence went through a slight correction in the second quarter of 2021 but it’s now back on track. Despite rising prices and low inventory, shifting attitudes of American home buyers may still contribute to pricing to avoid an affordability ceiling. Matthew Garnder expands on this in the next section.
Home Purchase Sentiment Index with Insights from Matthew Gardner
In his most recent Monday with Matthew video, our Chief Economist, Matthew Gardner, analyzed Fannie Mae’s most recent Home Purchase Sentiment Index figures. The data comes from a survey containing approximately 100 questions on housing-related topics. Fannie Mae collected 1,000 consumer responses from across the country. As Matthew Gardner says, “It’s the only national, monthly survey that’s focused primarily on housing.”
The survey shows that many Americans continue to think it is not a good time to buy because of the low supply and rapidly rising prices. However, many feel it is a good time to sell as consumers predict home prices and mortgage rates will go down. As Gardner explains, “most consumers continue to report that it’s a good time to sell a home, but a bad time to buy. They most frequently cite high home prices and a lack of supply as their primary rationale…However, the good time to buy component did tick up for the first time since March.” While this is a recipe to shift towards a buyer’s market, we’ll see how things unfold.
Gardner sums it up by saying, “Consumers tempered both their recent pessimism about home buying conditions and their upward expectations of home price growth.” So again, we are seeing the potential for a shift toward a more balanced market.
Second Quarter Review for North Kitsap’s Market
Data for the second quarter is out, and North Kitsap’s real estate market exceeded our expectations. Below you’ll find a list of key highlights with helpful insights to keep you informed about our local market.
Our Strong Seller’s Market
Our inventory remains low and demand remains high. Remote work is now a prevalent part of our new working culture, and this enables many buyers to consider areas outside major cities. Eager buyers are outnumbering sellers in more rural markets. Our Brokers continue to experience situations where some buyers are outbid either by price or by an all-cash offer in this competitive market.
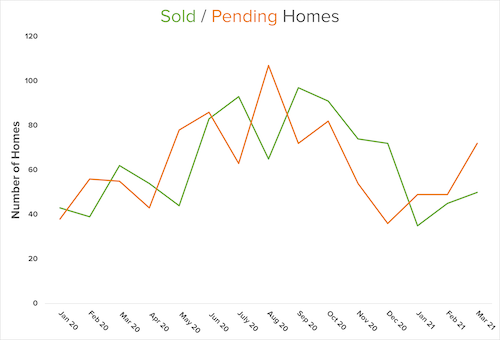
If you look at the last five quarters detailed in the graph below, there is a clear growth trend. This includes when you’re comparing 2020’s second quarter to 2021’s second quarter. This data indicates the market will continue to heat up this summer, which we’re already seeing.
Due to the low supply, prices are still on the rise. And, as you can see below, the listing and sale price divergence is shrinking now. Sellers can continue to ask for higher prices as a benefit of our inventory shortage. Also, historically low mortgage rates enable buyers to meet the home price increase.
Market Insights From Our Chief Economist
In his most recent Monday with Matthew, our Chief Economist, Matthew Gardner, begins with the staggering fact that “prices have risen almost three-fold, as the cost to finance has dropped by 72%.” If the number sounds too good (or bad) to be true, that’s because it is. To get an accurate picture, you also have to factor in inflation. Gardner explains that “just like other goods and services, the price of a house today is not directly comparable to the price of that same house 30 years ago because of the long run influence of inflation.” When you adjust for inflation, the rise in housing prices becomes less drastic. Without adjusting for inflation, “prices have risen by 268%”. But when you adjust for inflation, the “real prices have increased by 83.6%”. Therefore, the increase is much lower than what most people are discussing today.
Matthew also compares mortgage payments, another important piece of the puzzle. Although, without adjusting for inflation, “mortgage payments have increased by 74.3%,” the inflation-adjusted “real payments are 10.7% lower!” Of course, there are other monthly payments associated with home ownership. This includes property taxes, which do not change with market fluctuations. But this still indicates “that prices have been able to rise so significantly because mortgage rates have dropped”. It’s also because “inflation-adjusted home prices really haven’t skyrocketed – contrary to popular opinion.”
However, Matthew clarifies saying, “there are some markets across the country where the picture isn’t quite as rosy. In these places, prices have risen significantly more than the national average.” The Seattle metropolitan subunit (which extends around our local area) is one of these places. This is largely due to the increasing affluence as a result of the tech boom.
Not a Housing Bubble
Gardner’s bottom line is this: “there are quantifiable reasons to believe that we are not in a national housing bubble today.” However, he does point out that some markets will see a slowdown in price growth given “where prices are today in concert with the spectre of rising mortgage rates.” Ultimately, it’s still a strong seller’s market with an overall low supply and high demand. We expect to continue to see issues with affordability as prices and mortgage rates continue to climb.
First Quarter Review for North Kitsap’s Market

Our local real estate market is on the rise, and we had an interesting first quarter after the seasonal slowdown. We’ve compiled North Kitsap’s key market highlights so you can stay current with our local real estate market.
Our Strong Seller’s Market
Our area continues to have low inventory from the surge in demand with people moving away from the bigger cities. As COVID-19 changes the way we work, there are still many eager buyers outnumbering sellers. Some buyers are being outbid either by price or by all-cash offers. Our local experts are here to help navigate this competitive market.
When you look at 2020’s first quarter compared to 2021’s first quarter, you can see that a similar growth trend after the holidays is repeated. However, growth has slowed relative to last year, with much of North Kitsap’s inventory sold during the Covid boom. And, our lower supply may indicate prices will rise. Get ready for the market to continue to heat up as we move from spring to summer.
This strong seller’s market is driving us toward an affordability ceiling. There is a growing sale price and listing divergence, shown in the chart below. Prices may soon be too high for many people to afford to buy a home here. Sellers, however, continue to benefit from our inventory shortage, asking for higher prices.
Affordability Issues and Market Insights
Matthew Gardner, Windermere’s Chief Economist, continues to track this affordability ceiling in his most recent Housing and Economic Update: “If the pace of home price growth continues, many households will start to be priced out” of what people can actually afford. As Gardner points out, we need more supply, and we need home prices to drop to alleviate this market strain.
Unfortunately, that might not happen fast enough for many hopeful homebuyers to make their dream a reality. Gardner reminds us that the cost of materials, recent storms, and the current housing market prices have all added to the cost of building new homes. This, in turn, will add to the listing price.
Additionally, Gardner points out that mortgage rates have risen after “a jump in bond yields has led rates to spike” as the country re-opens and economic activity increases. The resulting potential inflation causes the 10-year treasury interest rates to rise in hopes of attracting more buyers. However, it is still far below standard rates and shouldn’t be a concern for buyers right now.
Ultimately, it’s still a strong Seller’s Market with an overall low supply and high demand. We expect to continue to see issues with affordability as prices continue to climb.
Fourth Quarter Review and Our 2021 Market Forecast

Kingston’s North Kitsap market ended 2020 with a strong fourth quarter. Below are key stats to provide an overview of our local market, as well as insights and a 2021 market forecast from Windermere Real Estate’s Chief Economist, Matthew Gardner.
Our Strong Seller’s Market
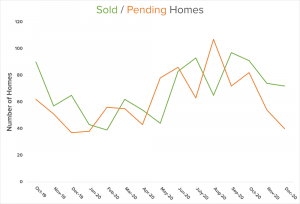
Kingston is still a seller’s market as we head into winter. There aren’t as many houses for sale despite a high demand. Buyers, be aware that while the market is in the usual seasonal slowdown – it’s not as slow as expected given COVID-19. Many are leaving bigger cities, giving the advantage to sellers. Our Brokers have seen an increase in situations where some buyers are outbid either by price or by an all-cash offer.
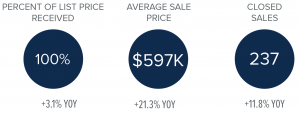
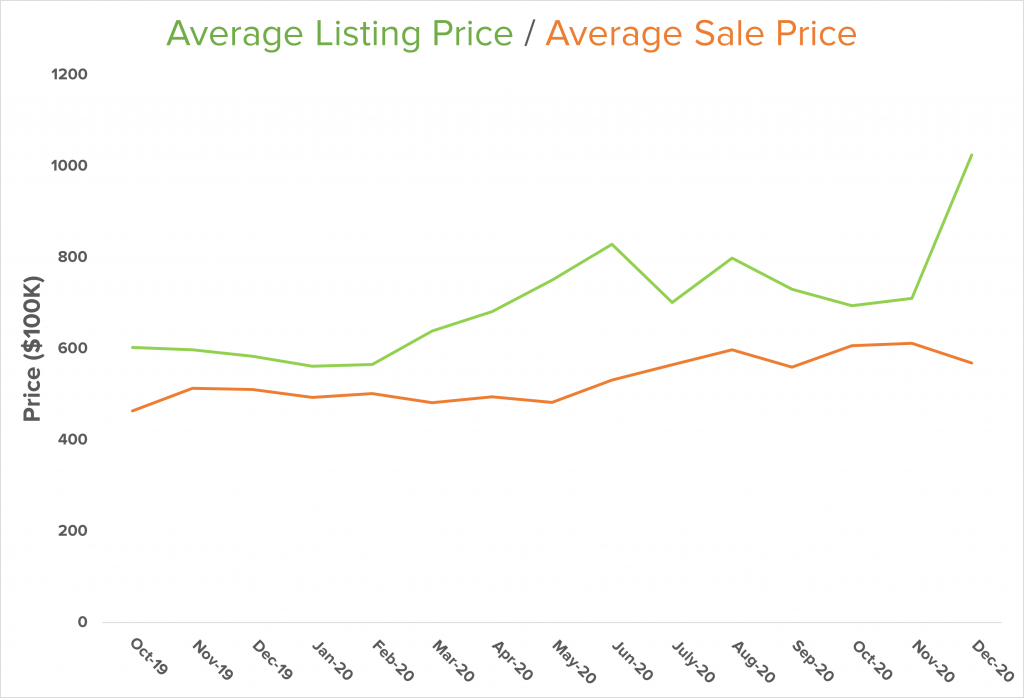
In 2020’s fourth quarter, the average sale price in North Kitsap was up 21.3% year-over-year at $597K. Sale prices continue to hover close to listing prices, indicating strong demand.
2021 Market Predictions
In his final Monday with Matthew video of 2020, our Chief Economist, Matthew Gardner, shared his 2021 market forecast. He’s optimistic and for some good reasons.
First off, Gardners expects mortgage rates will not rise significantly on a local level, nor will they vary significantly throughout different regions across the U.S. Since mortgage rates are heavily tied to 10 year treasury maturity rates/yields, rates shouldn’t rise significantly until the entire market recovers from the COVID-19 slowdown. Another great sign is that Gardner expects home sales will grow significantly, from 5.55% in 2020 to 5.93% in 2021. That’s “to a level we haven’t seen since 2006,” Gardner explains. With the continuation of historically low mortgage rates and the consistent increase of home values, 2021 looks bright.
“No! There isn’t a housing bubble forming. But price growth will slow & sellers may feel like it’s a collapse … it isn’t collapsing, it’s just normalizing.”
Matthew reminds us that there are pitfalls to be wary of in this strong market. First and foremost: “we need more inventory.” With the shuffling to new homes, and the huge wave of “first-time buyers [that] will continue to be a major player in the housing market,” many are making moves in a flood that will not persist. Buying during the pandemic will slowly settle. People are expected to stay in their homes longer, especially homeowners who have chosen to refinance. House values will rise due to the lack of supply, and that may price out many buyers who want to purchase in our area.
Western Washington’s Market Report
For a big picture glance at how our local market compares, here are highlights from The Western Washington Gardner Report.
WESTERN WASHINGTON HOME SALES
- Total Sales: 26.6% increase from Q4/2019, but 8.3% lower than Q3/2020
- Homes for Sale: 37.3% lower than Q4/2019, and 31.2% lower than Q3/2020
- Pending Sales: up 25% from Q4/2019, but 31% lower than Q3/2020
- Average: $617,475 (up 17.4% from Q4/2019). This continues the trend of above-average appreciation of home values.
- Interestingly, prices between Q3 and Q4 of 2020 only rose by 1%. Is there a price ceiling we’re reaching?
- Mortgage rates will stay competitive as the market continues to charge toward a price ceiling and potential affordability issues.
- Average: 31 Days (16 days less than Q4 just one year ago)
- In Kitsap County, average days on market: 17
Conclusion
2021 will continue the trend of working from home, which keeps demand high. This, in turn, will drive sales growth, while affordability barriers will balance our current runaway appreciation for home values.
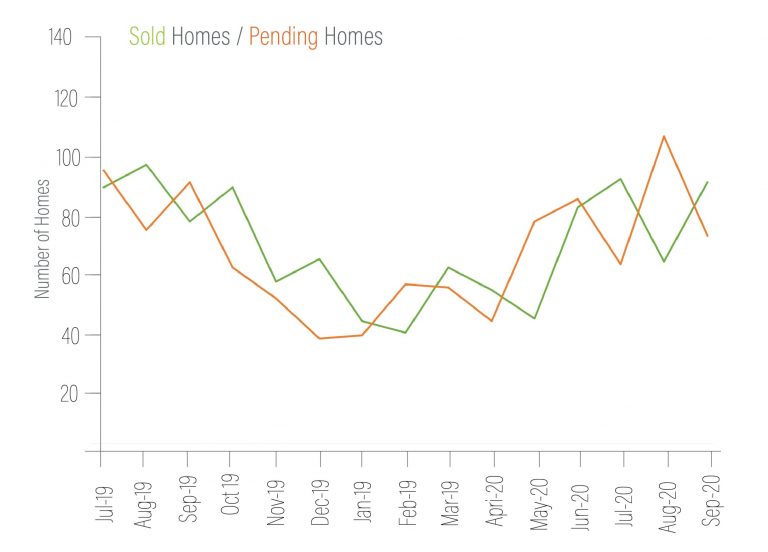
North Kitsap’s Market: Third Quarter Review and Forecast
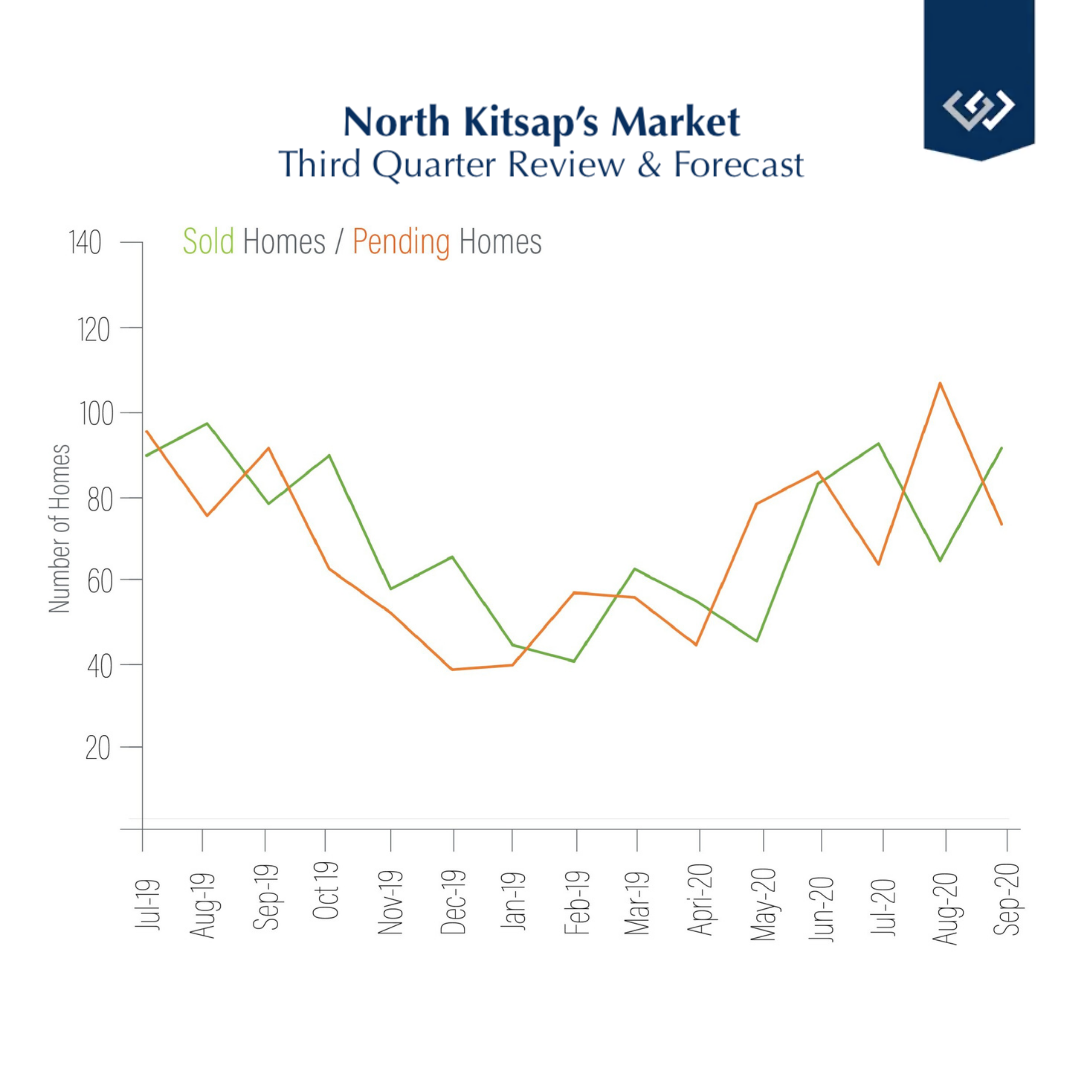
North Kitsap’s market had a very strong third quarter. We’ve compiled key stats below to provide a comprehensive review of our market, as well as insights and predictions from Windermere Real Estate’s Chief Economist, Matthew Gardner.
Our Strong Seller’s Market
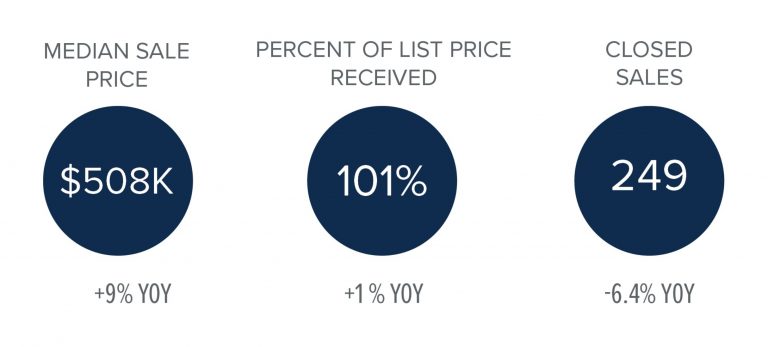
It’s a strong seller’s market here in North Kitsap. Inventory remains low while demand is high. In our third quarter, the median sale price was up 9% year-over-year at $508K. Buyers should be aware that multiple offer situations have become more common in our area. Our Brokers have seen an increase in situations where some buyers are outbid either by price or by an all-cash buyer.
Market Predictions
Although mortgage rates remain historically low and demand is high, our Chief Economist, Matthew Gardner, has some concerns about how this may impact real estate down the road. “We may be heading towards a period where we see houses turn over at a far slower pace as we stay in our homes for longer than ever…this could be a problem as it leads to persistently low levels of inventory for sale, which itself could lead to prices continuing to rise at above-average rates and that would further hit affordability.” As for mortgage rates, Gardner does not expect them to rise significantly any time soon. However, he says, “We should all be aware that there could be consequences to very low rates”.
Western Washington Review
Let’s zoom out a bit and look at our area. Below are highlights from The Western Washington Gardner Report provided by Windermere Real Estate’s Chief Economist, Matthew Gardner.
WESTERN WASHINGTON HOME SALES
- Total Sales: 11.6% increase from Q3/2019, and 45.9% higher than Q2/2020
- Homes for Sale: 41.7% lower than Q3/2019, but up 1.6% from Q2/2020
- Pending Sales: up 29% from Q2/2020
WESTERN WASHINGTON HOME PRICES
- Average: $611,793 (up 17.1% from Q3/2019). Low mortgage rates and limited inventory are clearly pushing prices up.
- Prices will continue to increase as long as mortgage rates and inventory levels stay low. If this continues to be the case, affordability issues will become more apparent in many markets.
DAYS ON MARKET, WESTERN WASHINGTON
- Average: 36 days (an average of 4 fewer days than in Q2/2020 and 2 fewer days than in Q3/2019)
- In Kitsap County, average days on market: 20
Conclusion
In Gardner’s Western Washington Report, he states that, although we have a strong seller’s market that is very buoyant, he’s “starting to see affordability issues increase in many areas—not just in the central Puget Sound region—and this is concerning. Perhaps the winter will act to cool the market, but something is telling me we shouldn’t count on it.”
